
Understanding ECG ST-Segment Changes with ST Map on a Patient Monitor
Hello from Bionet! 😃
Have you ever watched the ECG waveform continuously moving across a patient monitor?
An ECG reveals more than heart rate and rhythm. It provides a range of information about the heart’s electrical activity. Clinicians assess the shape of these waveforms and changes in their individual segments to help evaluate a patient’s condition.
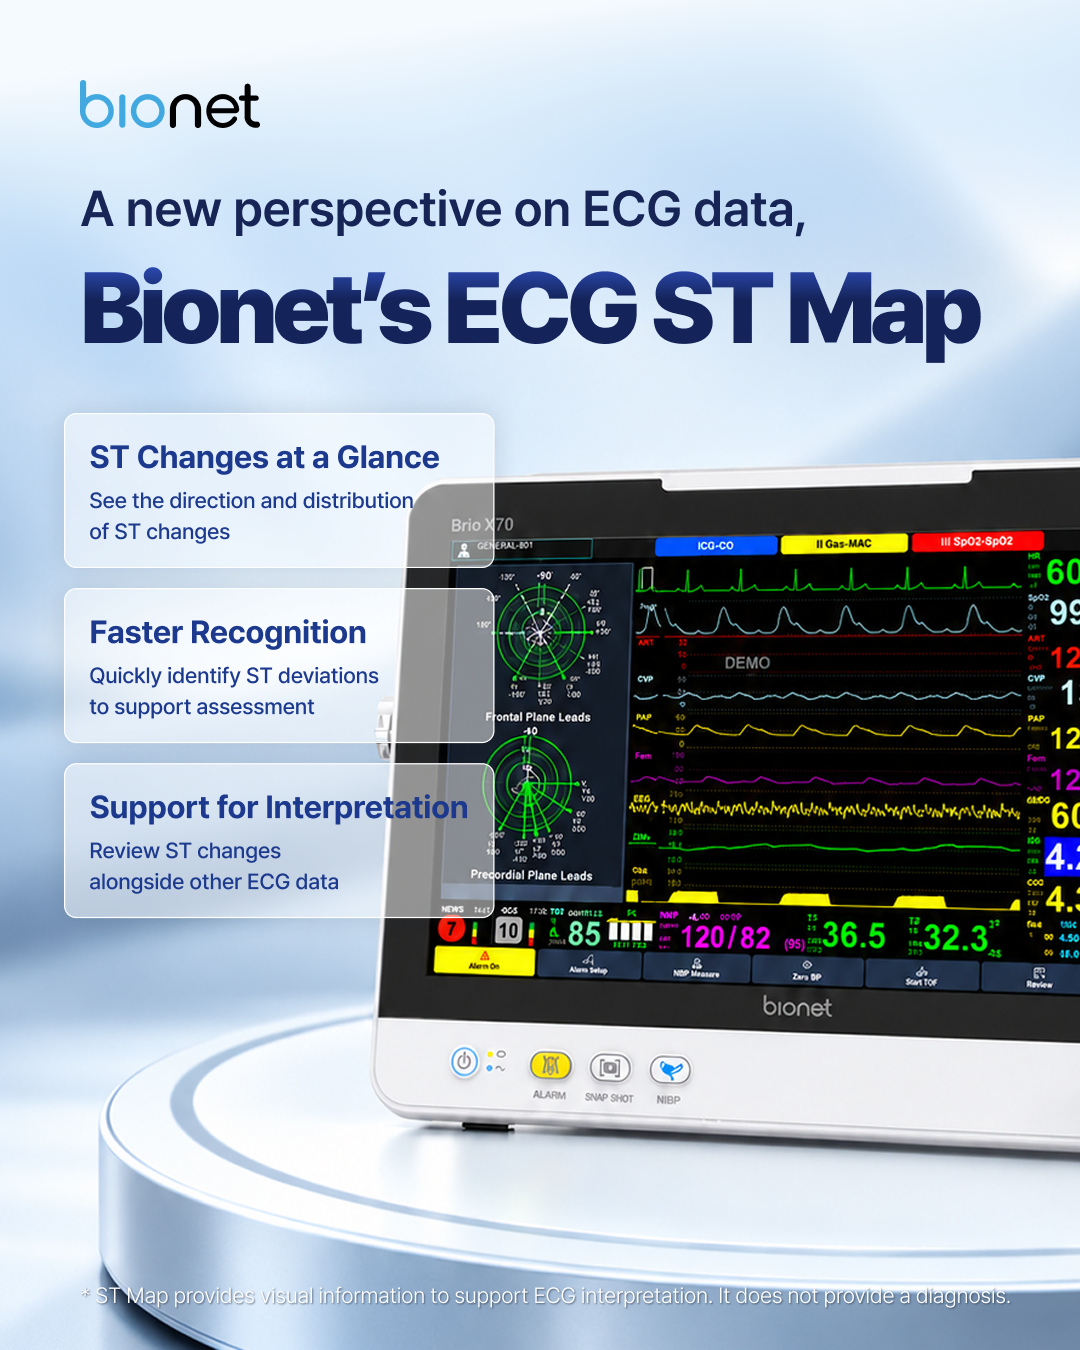
Today, we’ll take a closer look at the ST segment and introduce ST Map on the Bionet Brio X70 patient monitor, which presents ST information in a circular visual display. 🔍
Where Is the ST Segment on an ECG?
An ECG waveform includes several components, such as the P wave, QRS complex, and T wave.
The ST segment is the portion between the end of the QRS complex and the beginning of the T wave. In the illustration, look just after the tall R wave and the S wave that follows it, before the T wave begins.
When reviewing the ST segment, clinicians look for changes above or below the baseline.
ST elevation: The ST segment is above the baseline.
ST depression: The ST segment is below the baseline.
These changes can provide important clues when evaluating cardiac conditions, including myocardial ischemia and myocardial infarction.

Does ST Elevation or Depression Indicate a Specific Condition?
ST changes alone cannot confirm a specific diagnosis.
ST changes can occur with myocardial ischemia, a condition in which the heart muscle does not receive enough blood and oxygen. However, ST elevation or depression can also have other causes.
ST depression does not rule out damage to the heart muscle, either.
That’s why clinicians interpret ST changes alongside the patient’s symptoms, other ECG findings, blood tests, and additional clinical information.
ST information offers clues to a patient’s condition, but its meaning must always be considered in the clinical context.
What Does Bionet’s ST Map Show?
When ST information is presented as numerical values or individual waveforms, clinicians review the information from each lead separately.
A lead can be thought of as a view of the heart’s electrical activity from a particular direction.
Bionet’s ST Map visualizes ST information from multiple leads on a circular graph with concentric rings. By bringing these views together in one display, it helps clinicians see the direction and distribution of ST deviations across leads.
The circular ST Map is not an image of the heart itself. It is a visual representation of information obtained from the ECG.
On the Bionet Brio X70 patient monitor, ST Map offers an intuitive way to review this information.
📌 U.S. Patent for Bionet’s ST Map
Patent number: US 11,553,868 B2Date issued: January 17, 2023Patent title: ECG Data Display Method for Detection of Myocardial Ischemia


Three Ways ST Map Supports ECG Review
See the pattern of ST changes at a glance
Viewing the circular map alongside individual ST values helps clinicians recognize how ST deviations are distributed across multiple leads.
It provides a broader view of the overall pattern, complementing the review of individual ST elevations and depressions.
Identify information that may need a closer look
In patient monitoring, clinicians assess multiple sources of information at once. How that information is displayed matters.
ST Map organizes ST information visually, helping clinicians recognize patterns and identify findings that may warrant further review.
Review ST changes alongside other ECG information
ST Map can be used as part of a broader ECG review.
Clinicians interpret changes by considering the original ECG waveforms, numerical ST values, the patient’s symptoms, and other test results. ST Map adds a visual reference to support this process.
Patient Monitoring That Considers How Information Is Presented
Patient monitoring is about both measuring physiological signals and presenting them in a way that helps clinicians access the information they need.
The Bionet Brio X70’s ST Map presents ECG-derived ST information in a circular display to support clinical ECG interpretation.
We hope this introduction has made ST-segment changes—and the way ST Map displays them—a little easier to understand! 😊
We’ll continue sharing approachable insights into patient monitoring features and medical device technology. 🤗
▶ Explore Bionet Patient Monitoring Solutions
BM1 | Brio X30 | Brio X50 | Brio X70 | Oxy9wave | BM Central Pro
https://www.ebionet.com/medical/patient-monitors/
▶ What Is a Patient Monitor?
https://www.ebionet.com/about/blog/what-is-patient-monitor/
What Is a Patient Monitor? Understanding Patient Monitoring from the Hospital Ward to the ICU
▶ Product and Technical Inquiries
※ This content provides general information about the ST segment and ST Map. ST Map is a visualization tool that supports clinicians in interpreting ECG information; it does not provide a diagnosis. ST changes alone cannot confirm a specific condition or pinpoint the location of myocardial injury. They must be interpreted alongside the patient’s symptoms and other test results.


